
Semantic tagging and extensional navigation
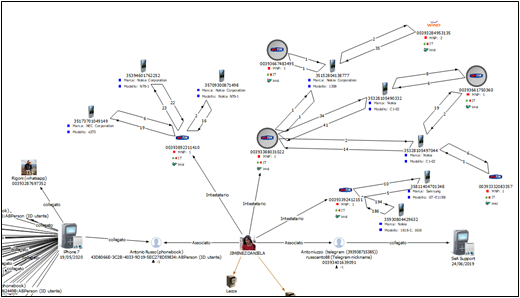
The integration is complete and guarantees the following functions: Semantic tagging of information using "i2 power2" technology; this method of delivering and expressing data in Analyst's Notebook allows Tetras 3 to communicate with all other power2 compatible products. Users with application solutions and systems, for example, can integrate the telephone traffic data (and more) processed by Tetras 3 with the sources managed by those systems (chamber of commerce sources, cadastral sources, automobile records, reputational sources, and major social networks) automatically. Extensional navigation; the integration enables graphs to be constructed in a completely incremental and user-controlled manner, which can launch queries to data in the Tetras 3 DB without ever leaving the Analyst's Notebook front-end in order to explore the relationships of the elements selected in the Analyst's Notebook chart.
Social profiles used & Audit
Full control of Analyst's Notebook while dealing with Tetras 3; full control allows you to: represent entities with custom ICONS or generated from other information linked with the entity (for example, representing international numbers with the flag of the matching country, i.e., telephone operator logo); As a result of adding elements, the graph will automatically apply layouts of various types; Use all of Analyst's Notebook's visual tools to depict data, such as frames, colored backgrounds, and varied sizes for entities, and varying thicknesses, hatches, and colors for relationships. Insert multimedia elements into the chart, such as images and other material inferred from devices and related with, for example, master data. For a more detailed and articulated perspective of the many situations being examined, use Analyst's Notebook's advanced analytical tools like as Bar Charts and Histograms, SNA, Conditional Formatting, Activity perspective, Connection Network Finder, and so on.
 “Il nostro intero lavoro si basa sulla convinzione fondamentale per cui – mentre i prodotti e le soluzioni software restano strumenti potentissimi ed imprescindibili – le indagini sono guidate dalle persone, dalla loro intelligenza, intuizione ed esperienza. La potenza e l’interattività delle soluzioni Intel IT ci consentono di avvicinare ancora di più i nostri utenti alla loro visione dei dati, guidando indagini di successo.”